People have worked with lists and tables of data for centuries. Until the last few decades the only option was a hand written list. You can imagine that a hand written list of information is not easily rearranged!
Let’s say you wrote down a list of names of people to invite to a reunion. You wrote the list in order by first name. Then you realize that you would prefer it in order by last name. So now you will need to write the list all over again in the correct order.
If you had typed it in an application like Microsoft Word or Google Docs it would be somewhat easier. You could copy and paste to move each line to where it belongs. But that still is tedious and takes a lot of time.
There is a better easier way! Spreadsheets are great at sorting data.
Take a look at the follow in table of information about the fifty states of the USA. It looks like it is sorted by total square miles right now. But what if you wanted to see it in order by square miles of water? How about alphabetically by state name? How many ways could the data be arranged?
| State | Total Rank | Total Miles^2 | Total Km^2 | Land Rank | Land Miles^2 | Land Km^2 | Land % | Water Rank | Water Miles^2 | Water Km^2 | Water % |
|---|---|---|---|---|---|---|---|---|---|---|---|
| Alaska | 665,384.04 | 1,723,337 | 570,640.95 | 1,477,953 | 94,743.10 | 245,384 | |||||
| Texas | 268,596.46 | 695,662 | 261,231.71 | 676,587 | 7,364.75 | 19,075 | |||||
| California | 163,694.74 | 423,967 | 155,779.22 | 403,466 | 7,915.52 | 20,501 | |||||
| Montana | 147,039.71 | 380,831 | 145,545.80 | 376,962 | 1,493.91 | 3,869 | |||||
| New Mexico | 121,590.30 | 314,917 | 121,298.15 | 314,161 | 292.15 | 757 | |||||
| Arizona | 113,990.30 | 295,234 | 113,594.08 | 294,207 | 396.22 | 1,026 | |||||
| Nevada | 110,571.82 | 286,380 | 109,781.18 | 284,332 | 790.65 | 2,048 | |||||
| Colorado | 104,093.67 | 269,601 | 103,641.89 | 268,431 | 451.78 | 1,170 | |||||
| Wyoming | 97,813.01 | 253,335 | 97,093.14 | 251,470 | 719.87 | 1,864 | |||||
| Oregon | 98,378.54 | 254,799 | 95,988.01 | 248,608 | 2,390.53 | 6,191 | |||||
| Idaho | 83,568.95 | 216,443 | 82,643.12 | 214,045 | 925.83 | 2,398 | |||||
| Utah | 84,896.88 | 219,882 | 82,169.62 | 212,818 | 2,727.26 | 7,064 | |||||
| Kansas | 82,278.36 | 213,100 | 81,758.72 | 211,754 | 519.64 | 1,346 | |||||
| Minnesota | 86,935.83 | 225,163 | 79,626.74 | 206,232 | 7,309.09 | 18,930 | |||||
| Nebraska | 77,347.81 | 200,330 | 76,824.17 | 198,974 | 523.64 | 1,356 | |||||
| South Dakota | 77,115.68 | 199,729 | 75,811.00 | 196,350 | 1,304.68 | 3,379 | |||||
| North Dakota | 70,698.32 | 183,108 | 69,000.80 | 178,711 | 1,697.52 | 4,397 | |||||
| Missouri | 69,706.99 | 180,540 | 68,741.52 | 178,040 | 965.47 | 2,501 | |||||
| Oklahoma | 69,898.87 | 181,037 | 68,594.92 | 177,660 | 1,303.95 | 3,377 | |||||
| Washington | 71,297.95 | 184,661 | 66,455.52 | 172,119 | 4,842.43 | 12,542 | |||||
| Georgia | 59,425.15 | 153,910 | 57,513.49 | 148,959 | 1,911.66 | 4,951 | |||||
| Michigan | 96,713.51 | 250,487 | 56,538.90 | 146,435 | 40,174.61 | 104,052 | |||||
| Iowa | 56,272.81 | 145,746 | 55,857.13 | 144,669 | 415.68 | 1,077 | |||||
| Illinois | 57,913.55 | 149,995 | 55,518.93 | 143,793 | 2,394.62 | 6,202 | |||||
| Wisconsin | 65,496.38 | 169,635 | 54,157.80 | 140,268 | 11,338.57 | 29,367 | |||||
| Florida | 65,757.70 | 170,312 | 53,624.76 | 138,887 | 12,132.94 | 31,424 | |||||
| Arkansas | 53,178.55 | 137,732 | 52,035.48 | 134,771 | 1,143.07 | 2,961 | |||||
| Alabama | 52,420.07 | 135,767 | 50,645.33 | 131,171 | 1,774.74 | 4,597 | |||||
| North Carolina | 53,819.16 | 139,391 | 48,617.91 | 125,920 | 5,201.25 | 13,471 | |||||
| New York | 54,554.98 | 141,297 | 47,126.40 | 122,057 | 7,428.58 | 19,240 | |||||
| Mississippi | 48,431.78 | 125,438 | 46,923.27 | 121,531 | 1,508.51 | 3,907 | |||||
| Pennsylvania | 46,054.34 | 119,280 | 44,742.70 | 115,883 | 1,311.64 | 3,397 | |||||
| Louisiana | 52,378.13 | 135,659 | 43,203.90 | 111,898 | 9,174.23 | 23,761 | |||||
| Tennessee | 42,144.25 | 109,153 | 41,234.90 | 106,798 | 909.36 | 2,355 | |||||
| Ohio | 44,825.58 | 116,098 | 40,860.69 | 105,829 | 3,964.89 | 10,269 | |||||
| Virginia | 42,774.93 | 110,787 | 39,490.09 | 102,279 | 3,284.84 | 8,508 | |||||
| Kentucky | 40,407.80 | 104,656 | 39,486.34 | 102,269 | 921.46 | 2,387 | |||||
| Indiana | 36,419.55 | 94,326 | 35,826.11 | 92,789 | 593.44 | 1,537 | |||||
| Maine | 35,379.74 | 91,633 | 30,842.92 | 79,883 | 4,536.82 | 11,750 | |||||
| South Carolina | 32,020.49 | 82,933 | 30,060.70 | 77,857 | 1,959.79 | 5,076 | |||||
| West Virginia | 24,230.04 | 62,756 | 24,038.21 | 62,259 | 191.83 | 497 | |||||
| Maryland | 12,405.93 | 32,131 | 9,707.24 | 25,142 | 2,698.69 | 6,990 | |||||
| Vermont | 9,616.36 | 24,906 | 9,216.66 | 23,871 | 399.71 | 1,035 | |||||
| New Hampshire | 9,349.16 | 24,214 | 8,952.65 | 23,187 | 396.51 | 1,027 | |||||
| Massachusetts | 10,554.39 | 27,336 | 7,800.06 | 20,202 | 2,754.33 | 7,134 | |||||
| New Jersey | 8,722.58 | 22,591 | 7,354.22 | 19,047 | 1,368.36 | 3,544 | |||||
| Hawaii | 10,931.72 | 28,313 | 6,422.63 | 16,635 | 4,509.09 | 11,678 | |||||
| Connecticut | 5,543.41 | 14,357 | 4,842.36 | 12,542 | 701.06 | 1,816 | |||||
| Delaware | 2,488.72 | 6,446 | 1,948.54 | 5,047 | 540.18 | 1,399 | |||||
| Rhode Island | 1,544.89 | 4,001 | 1,033.81 | 2,678 | 511.07 | 1,324 |
Create a new file
Let’s copy the table into a new spreadsheet file.
- Start from the main office.com screen and click on the Excel icon
- Then click on “New blank workbook”
- In the green bar along the top, click on the default file name and rename it to “sorting”
- Then copy the data from the table of information about the states.
- Paste it into your new worksheet.
- Click on the little dialog that is usually on the right side towards the bottom and then choose “Paste Values”. This will remove the formatting from this web page and just pasted the plain values into the spreadsheet.
- The easiest way to fix the column width is click on the upper left square of the grid to select all the rows and columns. Then double click the line between two columns and all the columns should autoresize to fit the information inside. If just the data is selected like it will be after you paste it in, it won’t work correctly. You need to select all the column as described.
- If you like, you can give the sheet a better name by double clicking on the tab where it says “Sheet1” and giving it a more descriptive name.
If you need help, watch the following video.
Now you are ready to sort the information.
- Click the “Data” menu.
- Select a cell somewhere within the table of data if you haven’t already.
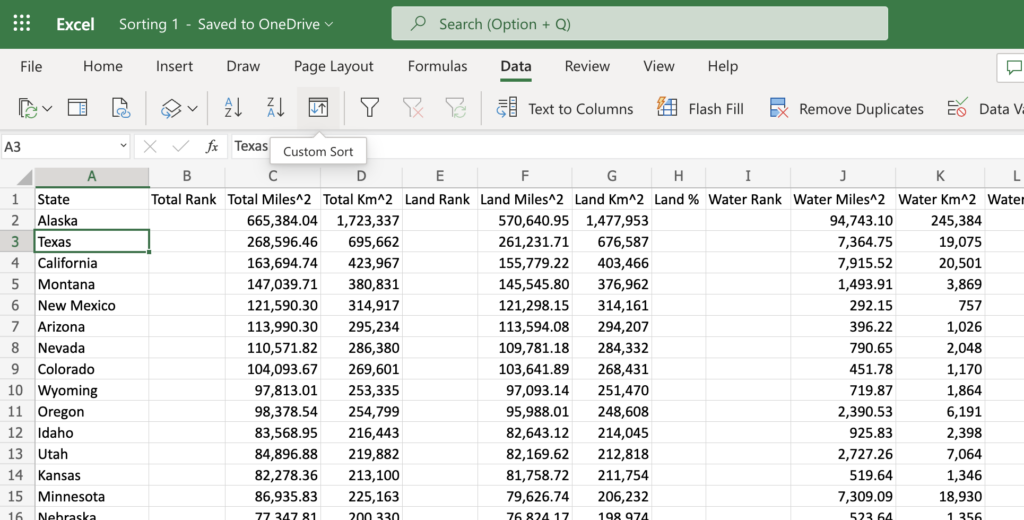
- Click the “Custom Sort” icon

- In the custom sort dialog, select “State” for the column.
- Leave the default sort on “Cell Values”.
- Also leave it on “Sort Ascending”.
- Click OK
Now the list should be sorted by “State”!
Auto Fill
All the major spreadsheets, including Excel, make it very easy to auto fill values from example content that shows a pattern. We’ll use this capability to add ranking numbers to the Total Miles^2, Land Miles^2, and Water Miles^2.
- Re-sort the list to be sorted by the Total Miles^2 in descending order.
- Type a “1” in “B2” and “2” in “B3”. This establishes a pattern of incrementing by 1.
- Select both cells
- Now click the handle on the bottom right corner of the selected cells and drag the selection down to the bottom of the data.
Watch the follow video if you have any questions.
That was really easy!
Now experiment with different patterns.
- Enter a “5” in “B2” and a “10” in “B3”
- Select both cells and then use the handle to auto fill down like you did before.
- Note how it counts up by 5s!
- Ok, now change it back to count up by 1s.
Continue Sorting and Ranking
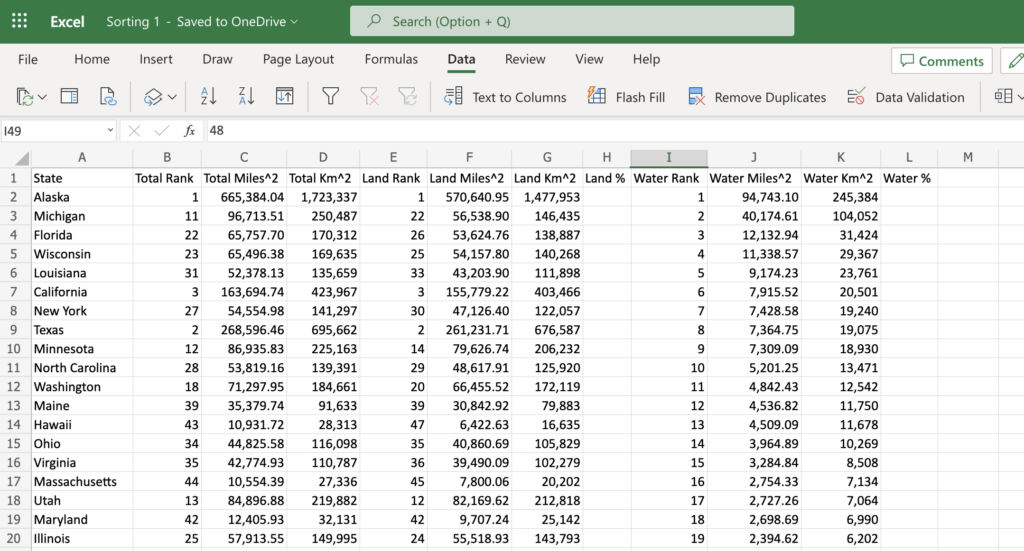
- Now sort and rank the “Total Land Miles^2” and “Total Water Miles^2.
- If you want to try a quicker way, you can sort the table by having a cell selected in the column that you want to sort. Then clicking either the “Sort Ascending” or “Sort Descending” icons that are to the left of the “Custom Sort” icon.
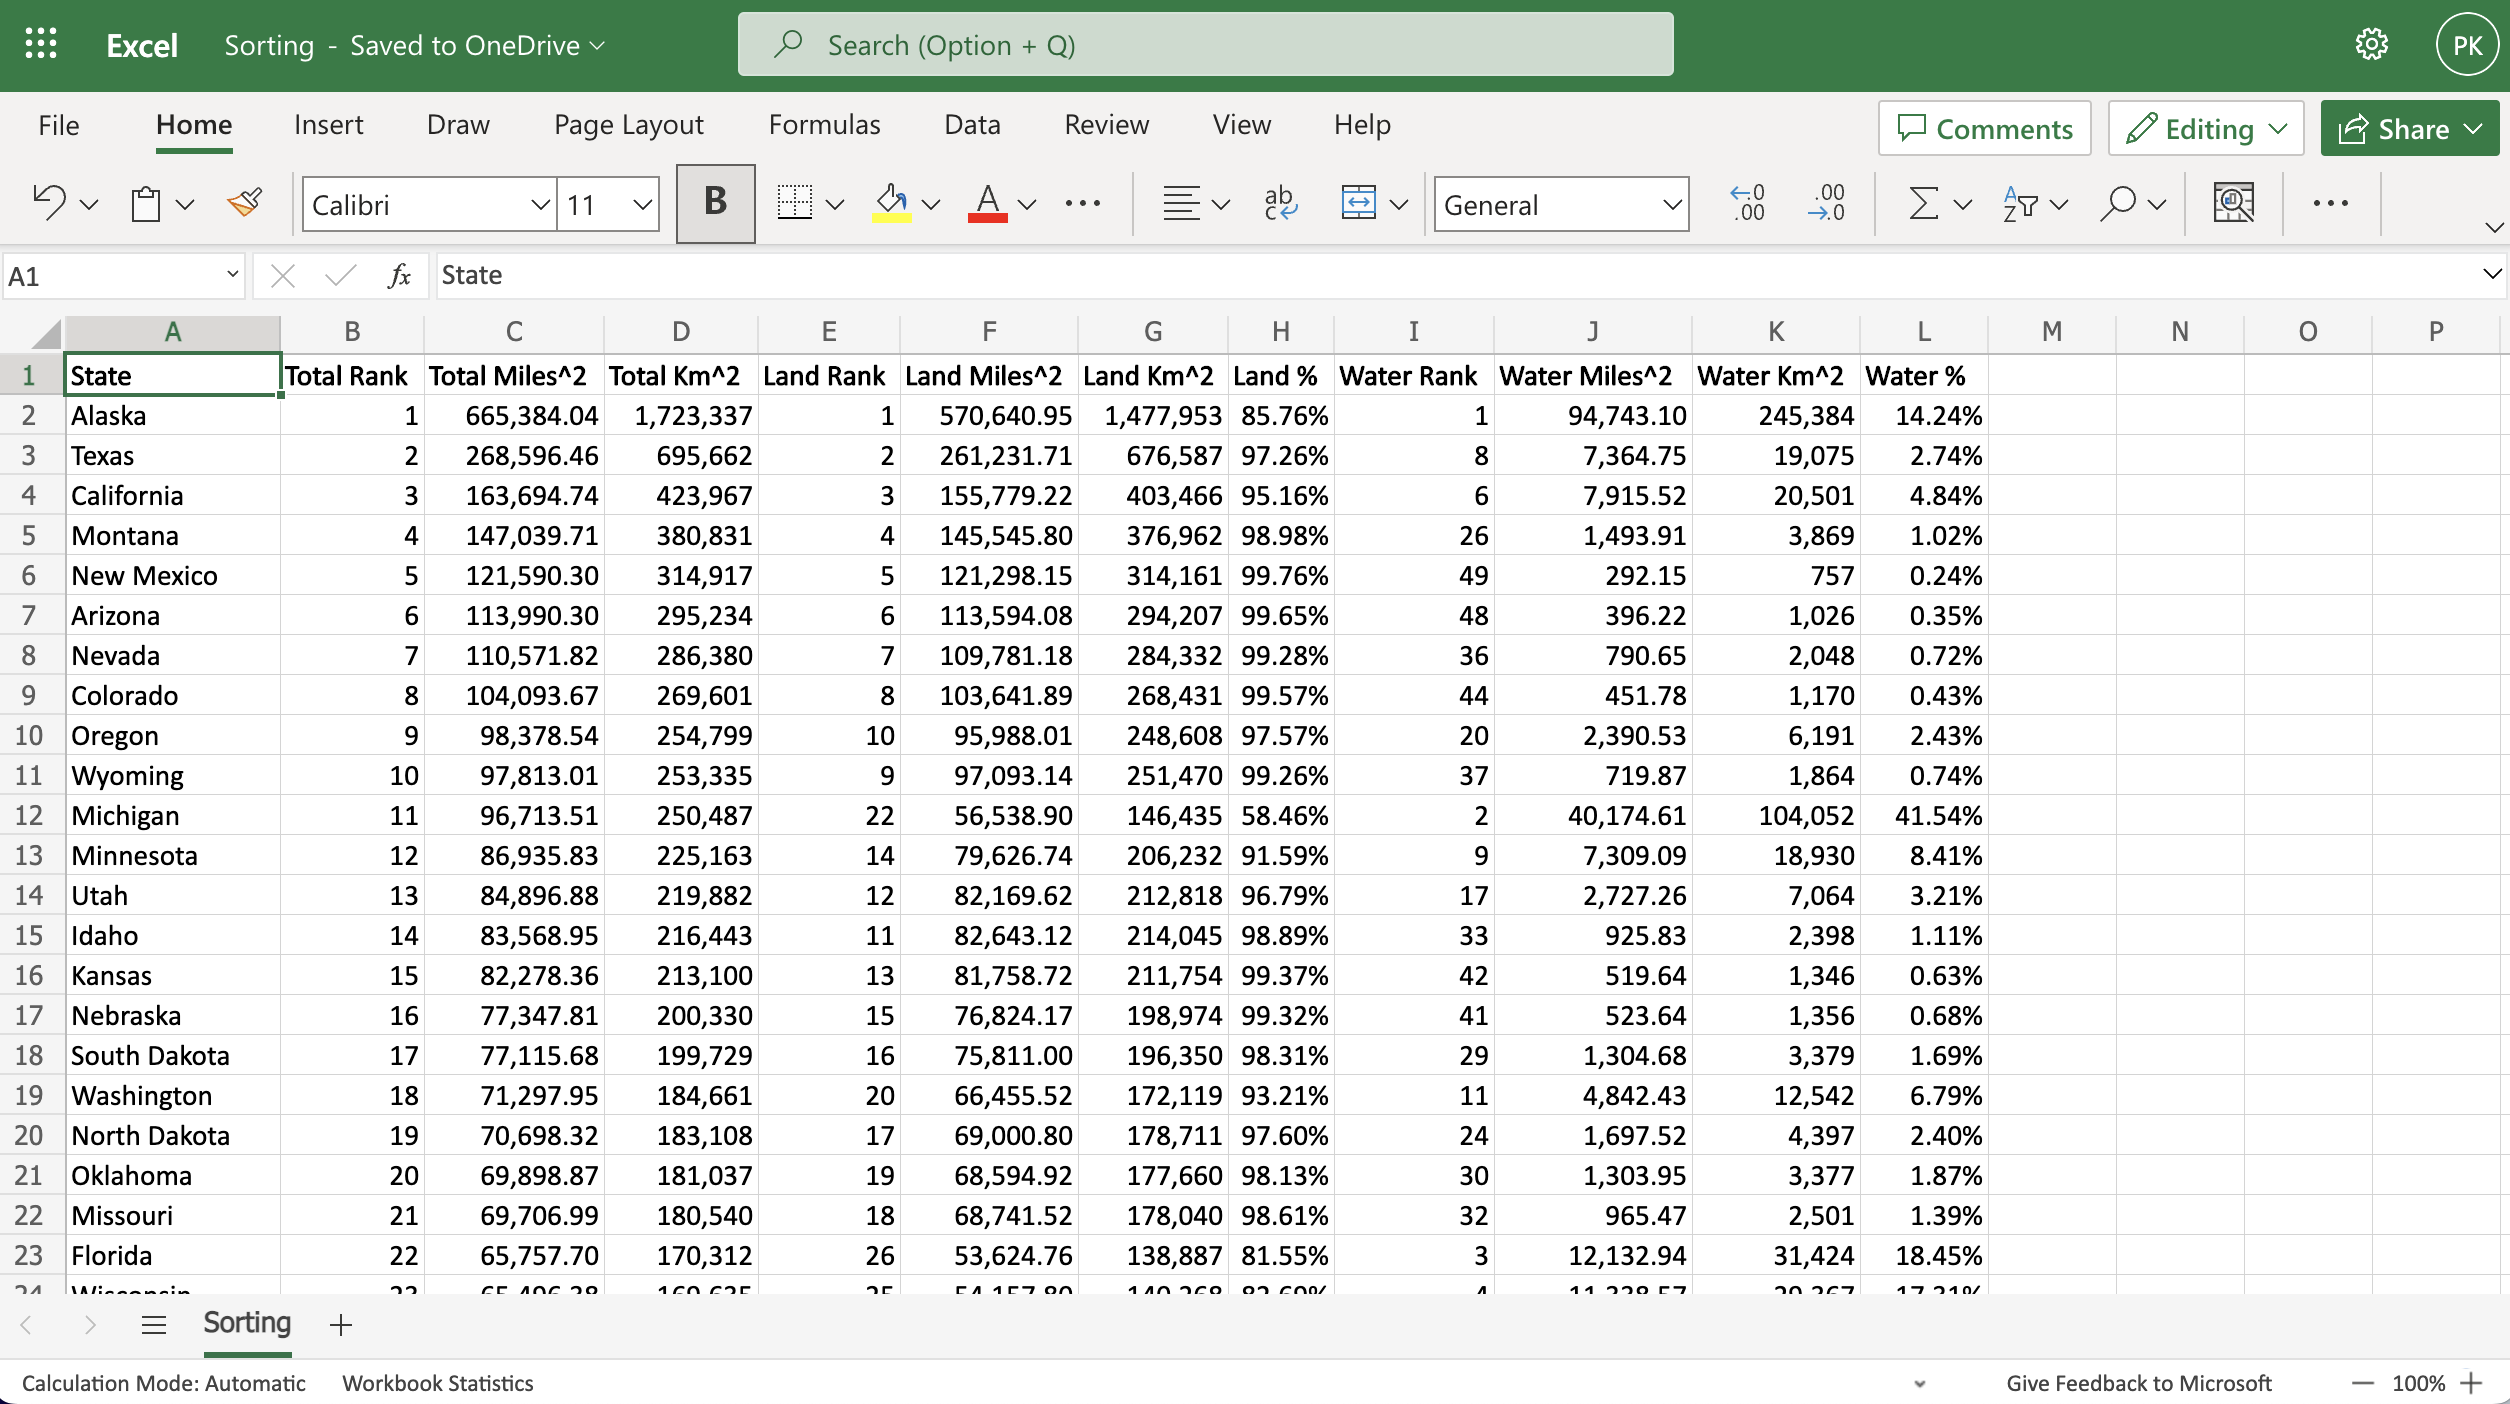
Does your worksheet look like the following screenshot? If not, see if you can fix it.

Add Some Data
Now let’s add in the percent of land and water information. Don’t worry! It’s not hard.
- Enter your first formula for the percent of land in “H2”.
- Remember how to figure what percent a part is of the total? Just divide the part by the total. Or in other words “Total Land Miles^2 / Total Miles^2.
- What are the cells that we need to use? Try “=F2/C2”.
- Now copy the formula down to the bottom of the data.
- Since it is showing is as a decimal we need to format the column as percentage.
- Select the entire “H” column by clicking the H.
- Go to the “Home” menu.
- Now choose the correct format of “Percentage” from the drop down list.
- OK! Now do the same for the “Water %” column.
- Enter the formula.
- Copy/Drag it down.
- Re-format it to “Percentage”.
Now you can sort the data by any column that you wish!!
Great job!

Leave a Reply
You must be logged in to post a comment.